Profiler
PHP code profiling allows you to inspect how much time and how many calls were made to every single function in the code.
Quickly Setup PHP for Profiling
- Ensure, you have PHP installed.
- Ensure Xdebug PHP extension is installed as well.
- Make sure PHP
zlibextension is enabled (recommended). - Check your
php.inisetting:xdebug.output_dir="<an output directory>" - Use the following
launch.jsonsetting:{ "name": "Launch Built-in server & Profile", "type": "php", "request": "launch", "runtimeArgs": [ "-S", "localhost:8888", "-t", "." ], "noDebug": true, // <-- disable debugging "profile": true, // <-- enable profiling "openProfile": false, // <-- whether to open profiling results after session ends }
After launching the built-in server using the launch configuration above, do a request to the web application. A new profile file (cachegrind.out.*.gz) will be created.
Opening Profiling Result
Open the file containing your profiling data. By default, it is in form of cachegrind.out.*.gz.
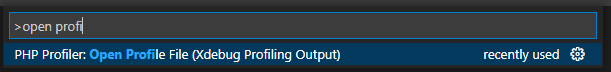
Using Command Palette
- Bring the Command Palette, and run
Open Profile File (Xdebug Profiling Output). - Choose the file, and confirm.
Drag & Drop 'cachegrind.out.*.gz' File
Alternatively, if your profile file name is in form of cachegrind.out.*.gz, you can open the file right in the Visual Studio Code editor - using File/Open File menu.
Be aware, large files may take some time to open.
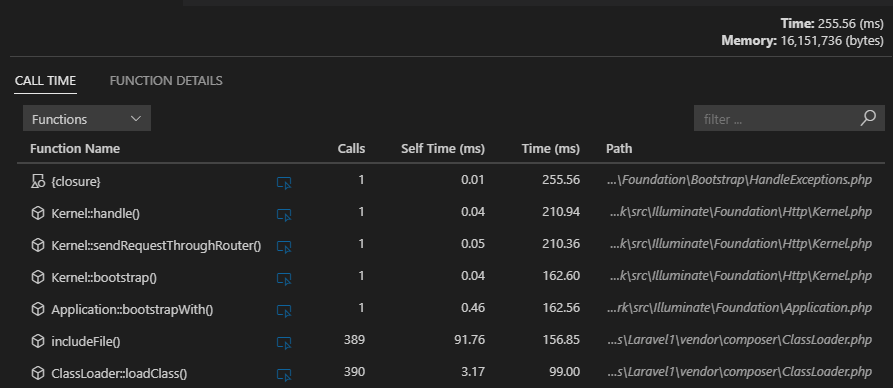
Inspecting Call Times
The following view lists all the functions with the number of calls (Calls), time spent by the function body (Self Time), and time including nested calls (Time).
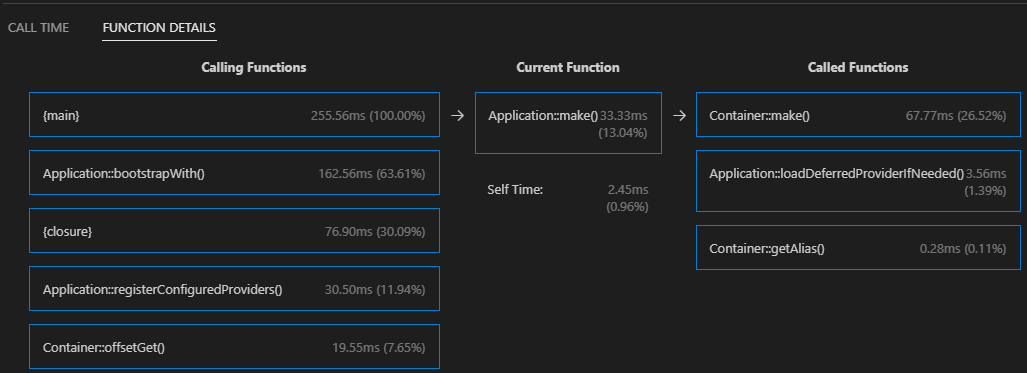
Inspecting Callers/Callees
The Function Details view is focused on a single function; and displays all the calling functions and all the called functions, including the time information.
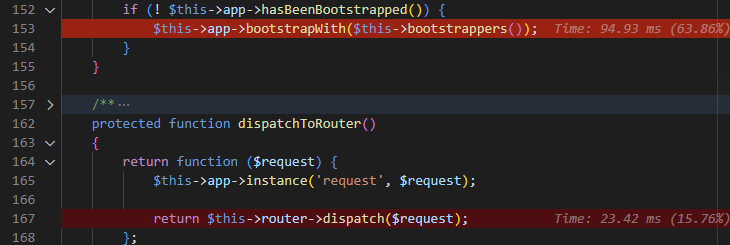
Highlighting Hot Paths
The loaded profiling result file is analyzed, and hot paths are highlighted directly in the source code. Highlighting can be turned off in the profiling result view.
See Also
- Debug - Debugging PHP in VS Code documentation.
- launch.json - VS Code launch profiles documentation.
- Profiling PHP in VS Code - A quick video tutorial on Profiling PHP using Visual Studio Code.
- Performance Profiling PHP with VS Code