Debug Overview
Debugging of PHP code in VS Code allows for inspecting a PHP program, inspecting actual variables, stack traces, exceptions, breaking and stepping through the code, debugging PHPUnit tests, and more.
Requirements
In order to debug a PHP program, you need PHP (either installed locally or on your server) together with Xdebug extension.
- PHP >= 5.6
- Xdebug extension. Follow the steps on Xdebug.org Install.
Local PHP Installation
In case there are more PHP installations on the system, see choosing PHP Version and select the right one.
To verify your PHP and Xdebug are installed correctly:
- Open a
.phpfile in VS Code - Open the
OUTPUTview, tabPHP.
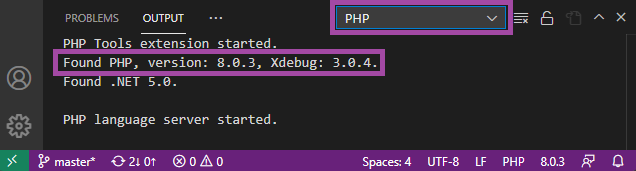
If PHP with Xdebug is installed correctly, you will see
Found PHP, version x.y.z, Xdebug: x.y.z.php.ini Configuration
Xdebug needs to be set in php.ini file that corresponds to your PHP installation.
- On Windows it is located next to your
php.exe. - On Linux/Mac, there is usually a separate
xdebug.inifile (usually something like/etc/php/8.0/cli/xdebug.ini).
Edit the .ini file, and ensure there are the following directives (Note, the directives are different for Xdebug versions 2 and 3):
; Xdebug 3
zend_extension = "<path to the xdebug library>" ; "...\xdebug.dll" or ".../xdebug.so"
xdebug.mode = debug
xdebug.client_host = 127.0.0.1
xdebug.client_port = 9003
xdebug.start_with_request = trigger
; Xdebug 2
zend_extension = "<path to the xdebug library>" ; "...\xdebug.dll" or ".../xdebug.so"
xdebug.remote_enable = 1
xdebug.remote_handler = dbgp
xdebug.remote_host = 127.0.0.1
xdebug.remote_port = 9000
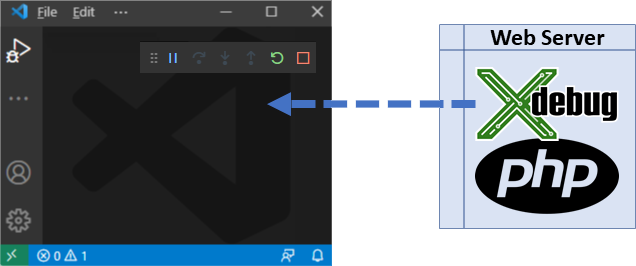
xdebug.remote_mode = reqServer PHP Installation
This applies to the situation when PHP is not running on your local system but it's on a Cloud, Web Host, Docker, Xampp, etc.
In case php itself is not running on your local system, consult the installation of PHP+Xdebug with the specific server host.
You can then take advantage of DBGP Proxy to allow multiple users to debug the same site safely.
Launching Debug in VSCode
Launch debugging in Visual Studio Code to either run the program and debug, or to listen for incoming Xdebug connections and debug. PHP debugging can be initiated in several ways, with or without VS Code Workspace, with or without the configured launch.json.
With launch.json
The file
.vscode/launch.jsonis a configuration file within your VS Code Folder or Workspace.
- Open Folder or Open Workspace in VS Code. This allows for specifying more detailed debug launch configurations.
- Navigate to
Run and Debugview, and clickcreate a launch.jsonor the configuration gear: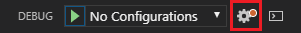
- See launch.json for the initialization and description of the PHP launch profiles.
No launch.json, Just Debug
Debugging can be started without any configuration. This is recommended if you just need to attach to an existing Web Server (with Xdebug configured) or to quickly run and debug a PHP script.
- Open a .
phpfile in VS Code (File / Open File). - Press
F5or Open Command Palette (F1) and choose one of the following: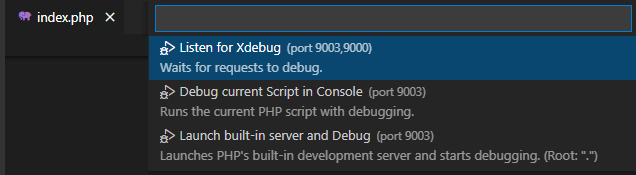
Listen for Xdebugstarts debugging and waits for an incoming Xdebug connection.Launch current script in consoleruns and debugs the currently opened PHP document as a console PHP program.Launch built-in serverstarts PHP development server within your opened folder, checks for the debugging capabilities, and starts listening for the Xdebug connections.
Features
The debugging features are the following:
- Stepping by line, step in, step out.
- Placing breakpoints, conditional breakpoints, break on hit count.
- Logging breakpoint hit into 'Debug console'.
- Breaking on exceptions, warnings, and errors.
- Specifying non-user files (exceptions won't break debugging, stepping through).
- Watch tool tips.
- Listing locals and superglobals.
- Editing variable or property value, handling long string values efficiently.
- Long arrays watch efficiently.
- Debug watch expands objects and arrays.
- Evaluating code in 'Debug console'.
- Debug launch profiles.
- Built-in web development server.
- Debugging of 'PHP Unit' test cases.
Debug Adornments
When stepping through the code, the editor will display values of variables and expressions corresponding to the current statement. Values are also shown for the enclosing scopes such as loop control variables, switch expression, and function parameters.
This feature can be enabled or disabled using VS Code Setting "debug.inlineValues".
Start Debug and Stop on Entry
Open command palette and run Start Debugging and Stop on Entry (aka Step Into). The command launches debugging and breaks on the first statement.
Troubleshooting
These are steps that should help to diagnose and solve common problems with debugging PHP:
-
Running the following command should display no warnings, and an Xdebug notice:
php --versionPHP 8.0.3 (cli) Copyright (c) The PHP Group Zend Engine v4.0.3, Copyright (c) Zend Technologies with Xdebug v3.0.4, Copyright (c) 2002-2021, by Derick Rethans -
The port number specified in Xdebug
.iniconfiguration should be9000or9003, or it should match the"port"specified in the Launch Profiles. -
Firewall must be properly set up to allow communication through the Xdebug port.
-
Append the following query parameter when opening the debugged PHP Web Site:
?XDEBUG_SESSION_START=1For example:
http://localhost/?XDEBUG_SESSION_START=1 -
In case the VS Code is behind a proxy, see https://code.visualstudio.com/docs/setup/network for additional settings.