Details View
Results with the profiling data are opened either from Profiling Tool Window or Test Explorer.
The Profiler Details View provides details about called functions, call graphs, memory allocations, and functions called in time. It allows for filtering by a function name, path, or whether it's a PHP internal or user function.
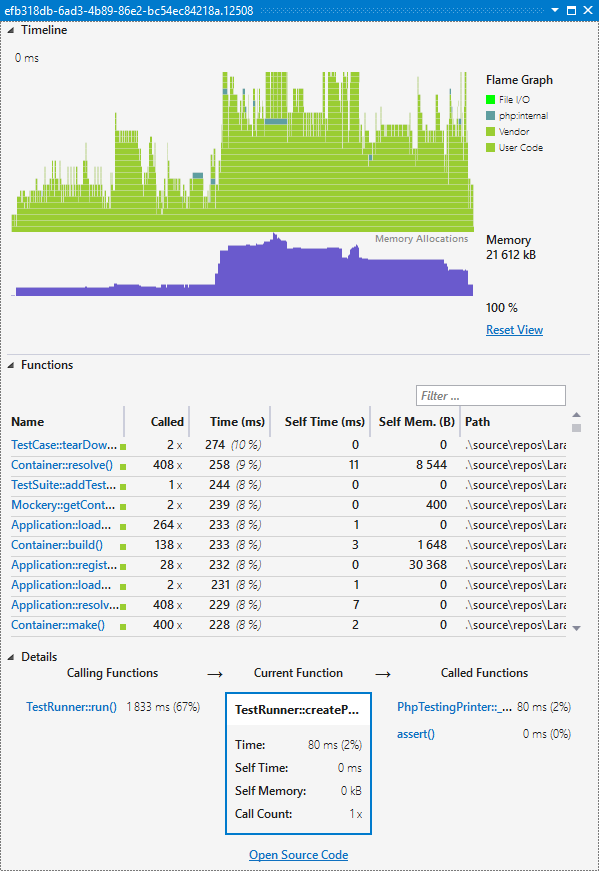
Timeline
Timeline features a so-called flame graph of function calls. It depicts functions called in time, and their call stack.
Zoom in/out using a mouse wheel.
Colors depict various function category; whether it corresponds to an internal PHP function, a function from vendor folder, or if it's a user function. Functions within categories can be hidden by clicking on the category legend on the right.
Functions
List of all the called functions including their
- Called: call count.
- Time: time that includes calls of other functions within.
- Self Time
- Self Mem: memory allocated within the function call.
- Path: locatiom of the function declaration.
The list can be filtered quickly using the Filter ... test box. It respects the original Xdebug identifier as stored in the cachegrind data file, so you can take advantage, for example, of the following terms:
->: instance method call.php:only internal function.closureonly anonymous functions.
Details
The boxes show details of a function, and all the function that called it, and all the functions being called. Navigate through this call graph by clicking onto the function names.