Profiling PHP Overview
PHP code profiling allows you to inspect how much time and how many calls were made to every single function in the code.
Requirements
Similarly to debugging requirements, profiling requires a local installation of PHP with Xdebug extension.
- Local installation of PHP (7 - 8.0, or newer)
- Xdebug PHP extension
Profiling Tool Window
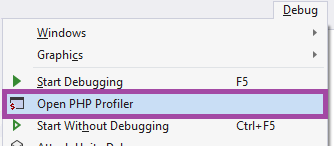
Open PHP Profiling Tool Window in Debug / Open PHP Profiler menu.
The PHP Profiling tool window lets you start a PHP profiling session, inspect requests, and open profiling results in a separate Profiler View.
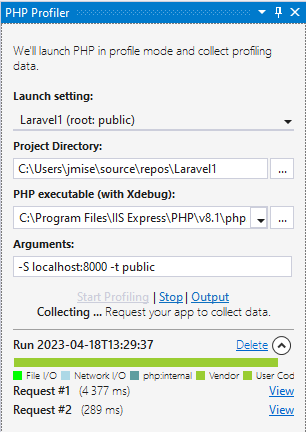
- Choose
Launch Setting, if you have a PHP project opened. - Specify
PHP executableto run. - Customize
Argumentsfor thephp.exe. By default, it's"-S localhost:8000 -t ."which starts a development server onhttp://localhost:8000. - Click
Start Profilingto launchphp.exewith the specified arguments. - In your browser, open
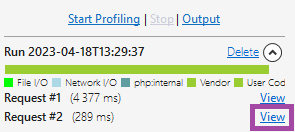
http://localhost:8000/(by default) to collect profiling data. Each finished request is listed in the tool window with brief information. To display details, clickView. - Click
Stop.
Inspecting Profiling Data
Open details by clicking on View. This will open Profiler View with collected data.
Opening Existing Profiling Results
In case the user has an existing profiling file (CacheGrind format, either uncompressed, or gz compressed), the file can be opened by drag&drop onto the Profiling Tool Window.
Profiling PHPUnit Test
See Profiling PHPUnit Tests for details.