Launch Profiles
Launch profiles define the way Visual Studio Code runs and debugs the project.
launch.json
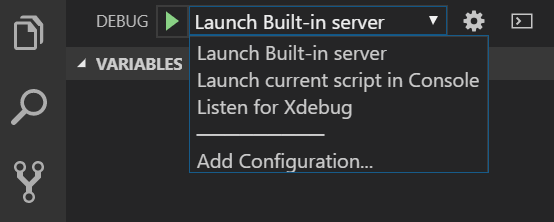
Visual Studio Code stores launching configurations in a launch.json file located in a .vscode subfolder of a workspace (the project root folder). To select, add, or modify the configurations, go to Run and Debug side panel.
Listen for Xdebug (Locally, or Remote Debug)
The following profile initiates debugging of an already running PHP application. The debugger will wait for an Xdebug connection on a specified port. PHP Tools won't start any Web Server. This is the most common debugging scenario requiring the user to correctly setup their php with xdebug extension.
{
    "name": "Listen for Xdebug",
    "type": "php",
    "request": "launch",
    "port": 9003,

    "pathMappings": {
        "\\remotepc\Shared\Test\": "${workspaceRoot}\src",
        "\\test": "C:\Users\usr\Documents\VSCode\src"
    }
}
Press F5 or Run and Debug to start listening for Xdebug connections.
portis the incoming Xdebug port number. It can be a single number (e.g.9003), or an array of numbers (e.g.[9003, 9000]), or it can be removed so the debugger will use the port specified in"php.debug.port"setting.pathMappingsis used for remote debugging. This setting maps server paths to local paths, so the debugger will match breakpoints on the local machine with the server paths.hostnameallows to specify whether to listen on IPv4 (0.0.0.0) or IPv6 (::). By default, the debugger listens on IPv4 (0.0.0.0) and tries to listen on IPv6 (::) as well. On Linux systems, listening on both networks might not be allowed so thehostnameshould be specified explicitly.
Listen on IPv6 on Linux
On Windows, debugger listens on both IPv4 and IPv6 at the same time. On Linux, the protocol should be specified explicitly. The following launch profile listens on IPv6, default ports (9003, 9000):
{
    "name": "Listen on Xdebug (IPv6)",
    "type": "php",
    "request": "launch",
    "hostname": "::"
}
If "hostname" is not specified, the debugger listens on IPv4 by default.
DBGp Proxy settings
The multi-user debugging in more detail is described at tutorial for Visual Studio version. In VS Code the configuration is placed right into the launch.json file.
The launch configuration for Listen for Xdebug together with dbgpProxy configuration is listed below:
{
    /* listening for Xdebug connection: */
    "name": "Listen for Xdebug",
    "type": "php",
    "request": "launch",
    "port": 9003,

    /* DBGp Proxy configuration: */
    "dbgpProxy":
    {
        "enable": true,
        "host": "127.0.0.1",
        "port": 9002,
        "ideKey": "MyVSCode"
    }
}enableturns on or off connection to DBGp Proxy server.hostandportspecify the address of the DBGp Proxy serverideKeyis used to register the debug session within the DBGpProxy. If not set, the current user name is used instead.
Upon running the project (F5 or Run and Debug command), the following text gets logged in the Debug Console:
Registering with the DBGp proxy on 127.0.0.1:9002 with key Arnold...
Registration was successful!
DBGp Proxy IDE key
Note, if not specified, the DBGp proxy IDE key is set automatically to the current user user name. It is also logged in the VSCode's Output Window. When accessing the web, this IDE key has to be used in the URL(e.g. http://example.org?XDEBUG_SESSION_START=MyVSCode), or xdebug.idekey php.ini directive, or DBGP_IDEKEY environment variable (see xdebug.org for more details). This way the proxy server knows which machine to connect back to with the debug session.
Ignored Paths
To ignore custom paths (like **/vendor/**) from being stepped into and breaking on exceptions, specify "exclude" : ["**/vendor/**"] launch setting.
Debugger won't step into and won't break on handled exceptions within files matching specified glob patterns.
Example with the "exclude" configuration:
{
    /* listening for Xdebug connection: */
    "name": "Listen for Xdebug",
    "type": "php",
    "request": "launch",
    "port": 9003,

    /* ignore files in 'vendor' folder from being stepped into and exceptions */
    "exclude": [
        "**/vendor/**"
    ]
}
Excluding everything except
To ignore everything except a specified path, use the negation prefix !, e.g.:
    "exclude": [
      "!**/app/**",
      "!**/vendor/mypackage/**",
    ]
Built-In PHP Server
The following profile starts the PHP built-in web server. The server is started only if the runtimeArgs contains the parameter -S that defines the location and port of the server.
Sample configuration:
{
    "name": "Launch Built-in server",
    "type": "php",
    "request": "launch",
    "runtimeArgs": [
        "-S",
        "localhost:8888",
        "-t",
        "\\remotepc\Shared\Test"
    ],
    "port": 9003,
    "serverReadyAction": {
        "action": "openExternally"
    }
}
Additionally, there are the following settings:
- "port" allows you to specify the Xdebug port number. This value is used set to configure the built-in server and the VSCode debugger together. The default value is specified with configuration
php.debug.portwhich defaults to[9003, 9000]. It overwrites the settingxdebug.remote_portin yourphp.ini. - serverReadyAction can be set to automatically open browser once the debug starts. More at code.visualstudio.com - serverReadyAction.
Built-In PHP Server with router.php
The following let's you to run built-in PHP server with a router script. It's equivalent to the "Launch Built-in server" configuration, but the router.php path is added to the "runtimeArgs" array:
{
    "name": "Launch Built-in server with router script",
    "type": "php",
    "request": "launch",
    "runtimeArgs": [
        "-S",
        "localhost:8888",
        "-t",
        ".",
        "./router.php"
    ],
    "serverReadyAction": {
        "action": "openExternally"
    }
}
Console Application
This profile runs the PHP project as a console application, inside the VS Code's Debug Console. By default, it starts a file currently opened in the editor.
{
    "name": "Launch current script in Console",
    "type": "php",
    "request": "launch",
    "program": "${file}",
    "cwd": "${fileDirname}",
    "externalConsole": false
}
Useful parameters that can be changed:
program: Specifies a file absolute or relative to workspace's directory. Value${file}means the file currently opened in the editor.externalConsole:trueto run the program in a separate command line window. Default isfalseto output the program in the VS Code'sDebug Console.port: is the Xdebug port number. This value has to match setting inphp.ini. Defaults to9003.
Profiling Mode
Profiling collects data about your application and saves them into a directory specified with xdebug.output_dir PHP ini setting. Add "profile": true setting, to profile requests and console application. Note, "profile" setting cannot be used when only listening for Xdebug.
Example:
{
    "name": "Launch Built-in server & Profile",
    "type": "php",
    "request": "launch",
    "runtimeArgs": [
        "-S", "localhost:8888", "-t", "."
    ],
    "noDebug": true, // <-- disable debugging
    "profile": true, // <-- enable profiling
    "port": 9000,
}
PHP Version
The launch configuration option "phpVersion" allows choosing which PHP will be used to run and debug the project.
It is possible to define more launch configurations, each with a different PHP version. While the workspace assumes one PHP version at a time (see php.version setting), launch configuration can use a specific PHP to be used for built-in web server or a console application.
Example:
{
    "name": "Launch Built-in Server with PHP 8",
    "type": "php",
    "request": "launch",
    "runtimeArgs": [
        "-S",
        "localhost:8888",
        "-t",
        "."
    ],
    "phpVersion": "8.0"
}
Note: In this example, it is assumed that the PHP 8.0 is installed on the local machine.
Related Links
- Compound Launch and Debug - Start and debug more built-in servers at once.