Remote debug
In case the PHP code is running on a remote server (on any platform), it is still possible to debug it inside a local Visual Studio. This option is available in the PHP project properties, under the Server tab.
We've prepared a detailed tutorial on how to setup PHP remote debugging on Ubuntu
Configure Remote Debug
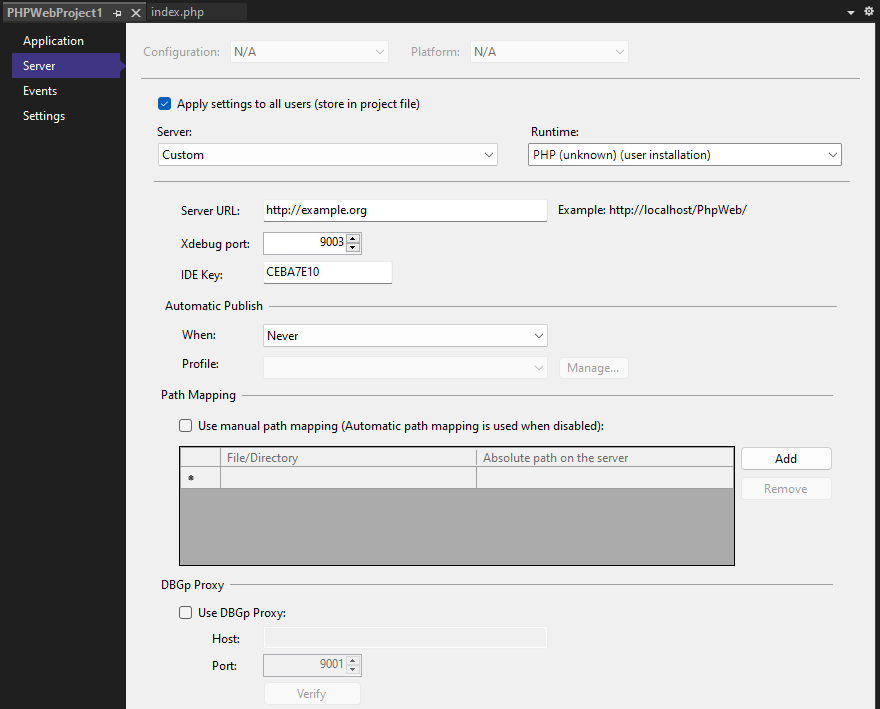
Go to Project / Properties, and switch to Server tab, as depicted on the screenshot below.

Under the Server drop-down list, choose the Custom option. And fill in the following fields:
-
Server URL: is the full public URL where the remote server hosts the PHP application.
-
Xdebug port: matches the configured Xdebug port number (aka "remote port" or "client port"). Xdebug (the debugging extension installed on the remote server) will contact Visual Studio on this port number. See configuring Xdebug for more details.
-
IDE Key is a key that will identify IDE or a particular project. You can leave the value which is generated automatically or change it to anything else which will be unique.
-
Path Mapping is optional set of directory mapping paths on the remote computer (absolute directory path - right column) to the corresponding path on the local computer (relatively to the project root - left column). This allows convenient debugging of the remote code even in case the project structure is more complex and the local directory structure does not match exactly the remote directory structure.
If the mapping is not set, the debugger will infer the simple mapping automatically based on the first script that is hit by the debugger.
-
DBGp Proxy is a standard proxy configuration allowing more developers to debug the same remote project. Configure the values according to your proxy. See multi-user debugging for more details. Note, that
IDE Keyis used as a DBGp Proxy key to identify your IDE and project.The proxy configuration can be validated right on the Project Properties tab using the
Verifybutton, as depicted below:
Starting the debug
Once the project is configured to debug using a custom server, initiate the debugging in a standard way - either press F5 or go to Debug / Run. The server URL gets opened in the browser.
Optional - Automatic publish
Usually, the project is developed locally and deployed on the remote server. For this purpose configure the Automatic Publish section of the project properties. This allows to continuously upload the locally modified file over to the remote server upon starting the debug session.
Troubleshooting
Please watch Visual Studio's Output pane for details. Every important step or error gets logged there. This might help you to get additional information.