Breakpoints
Breakpoints are an essential tool for debugging your applications. You set the breakpoints whenever you want to pause the execution. When paused you can investigate the program's state - check the values of variables or look at the call stack.
Set a breakpoint on a line in source code
You can set a breakpoint on any line of executable code by clicking in the margin of the code editor, or by right-clicking on a line of code and selecting Breakpoint, Insert Breakpoint, or simply by pressing F9 (This is a typical shortcut; check the Debug, Toggle breakpoint in the settings menu).
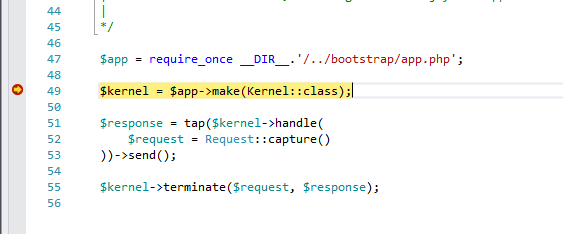
When you debug, the debugger will pause the execution before the line with the breakpoint is executed.
Executable code and breakpoint resolution
The breakpoint will only work when placed on a location associated with actual PHP executable code.
When the breakpoint is placed on a location without PHP executable code, breakpoint resolution mechanism is used to move the breakpoint to a line where it can break (it has to be within 5 lines). This feature is supported since Xdebug version 2.8 and higher.
Breakpoint conditions
You can control when breakpoint stops the execution of the program by setting conditions.
To set a breakpoint condition:
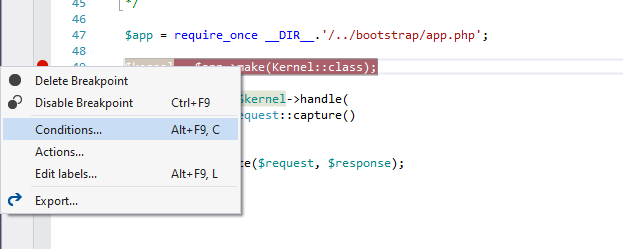
- right click on the breakpoint symbol (in the editor left margin or in the Breakpoint window) and select Condition... (or press Alt + F9, C), which will open Breakpoint Settings window.
-
To set a breakpoint condition, in the first drop-down menu select
Conditional Expression. -
In the second drop-down menu, choose
Is trueto break when the expression is satisfied, orWhen changedto break when the value of the expression has changed.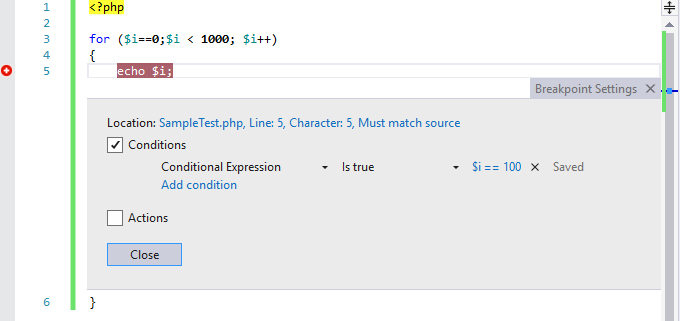
Note: When the breakpoint with
When changedcondition is first evaluated, the debugger doesn't consider it to be a change, so it doesn't break.
Set a hit count condition
When you want a breakpoint to break after it has been hit a certain amount of times, you can choose Hit Count in the Breakpoint Settings and specify the number of iterations.
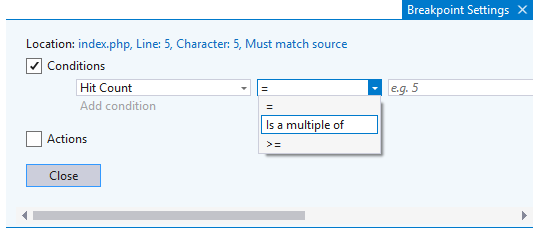
This is feature is useful when you notice that a certain loop misbehaves after a certain number of iterations. Rather than stepping through the loop by repeatedly pressing F5, use Hit count.
Tracepoints (Breakpoint Actions)
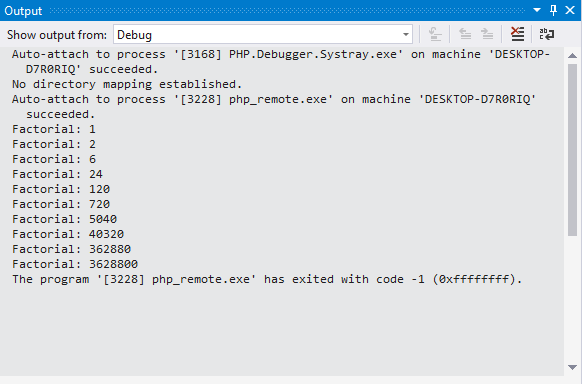
Tracepoint is a breakpoint that prints a message to Output pane - Debug when hit, but it doesn't break the execution of the program.
To set a tracepoint:
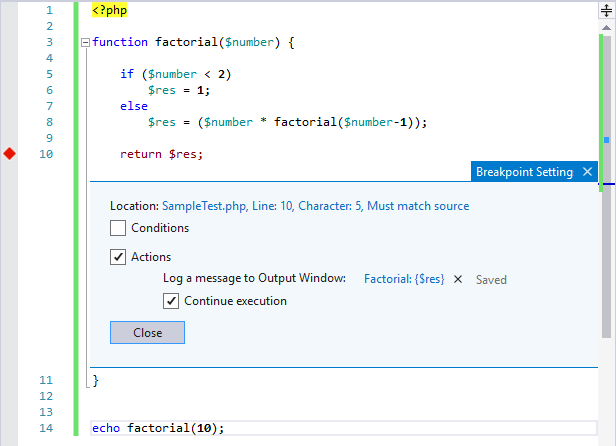
In Breakpoint Settings window check Actions and provide a log message. The log message can contain variables (placed between { and }), including predefined special variables listed below:
| Keyword | What is Displayed |
|---|---|
| $ADDRESS | Current instruction |
| $CALLER | Calling function name |
| $FUNCTION | Current function name |
| $PID | Process ID |
| $PNAME | Process name |
| $TID | Thread ID |
| $TNAME | Thread name |
| $TICK | Tick count (from Windows GetTickCount) |
A sample of the output is depicted below:
You can find the sample use case here
Function breakpoints
You can break execution when a function is called. This is useful when you know a function or method name, but you don't know the location (or you do know and you just don't want to search for it). The other use case would be if there are multiple methods or functions with the same name (e.g. same function in different namespaces or method implemented on multiple classes) and you would like to break on all of them.
-
To place a function breakpoint, go to
Debug | New Breakpoint | Function Breakpoint, or press Ctrl + K, followed by B. Or if you have Breakpoints pane opened, click New and select Function Breakpoint -
When in the New Function Breakpoint dialog, enter the function or method name.

-
Make sure PHP is selected in the language drop-down
-
Hit ENTER
If the function or method is in the project the breakpoint will bind.
When providing a function name, you can be more specific. The syntax for the function breakpoint is <directory_string>!<type_name>::<function_name>(), where type_name and function_name can be fully qualified or the namespace part can be omitted.
These syntaxes are possible:
function_or_method_namefunction_or_method_name()fully\qualified\function_name::method_nametype_name::method_namefully\qualified\type_name::method_namedirectory_string!function_or_method_namedirectory_string!type_name::method_name
Names that are not fully qualified will be searched for within available namespaces, so you can type the name without the namespace.
Tip: Restrict the breakpoints only to functions defined in files that have the specified
directory_string!as a part of their path.
Break on Exception
You can define types of an exception that should break your program when they are thrown. See Exceptions to find out more about this.
Managing breakpoints
To see all the breakpoints in your solution, open Breakpoints window from Debug | Windows | Breakpoints or press Ctrl+ Alt + B.
From this window, you can enable/disable or delete breakpoints, search and sort them. You can change breakpoint settings directly from this dialog.

Tip: You can see how many times the breakpoint was hit in the
Hit Countcolumn.